Surface Properties
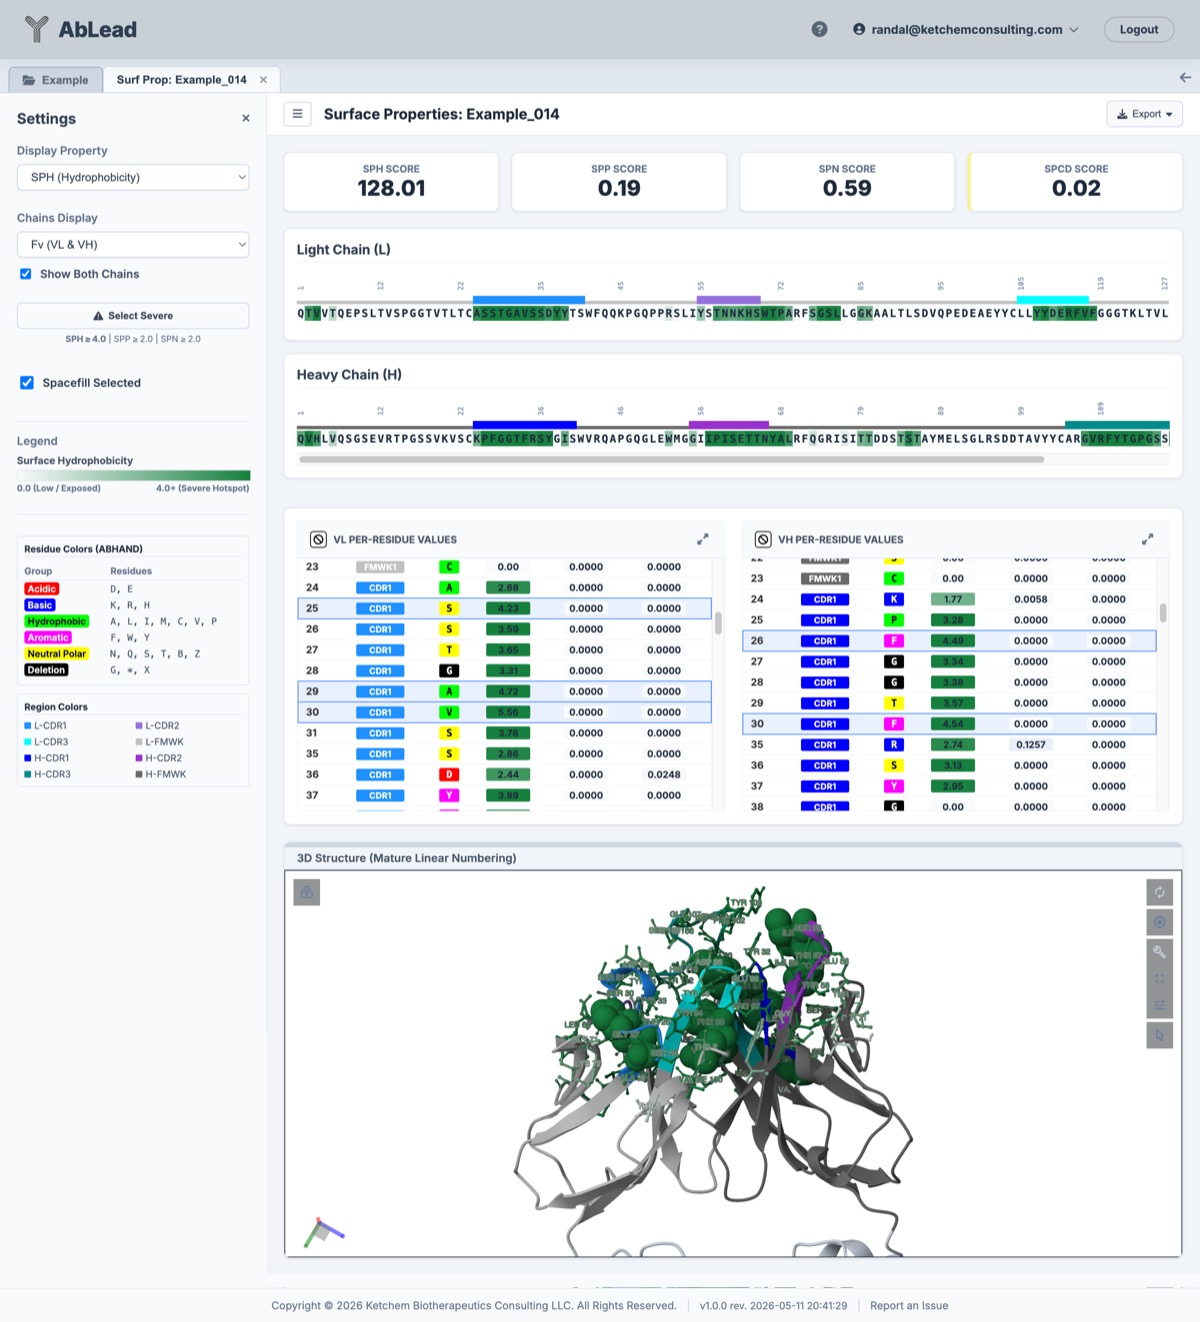
This interactive dashboard combines a surface properties data grid with a 3D structural viewer.
Surface Properties functions as a 3D Structural Hotspot Locator and Engineering Mutation Guide. Rather than attempting to serve as a continuous assay predictor (such as predicting exact HIC retention minutes or viscosity in cP, which depend heavily on multi-body dynamics, formulation buffers, ionic strength, and salts), this tool isolates the specific solvent-exposed residues and spatial clusters driving biophysical liabilities across the variable domain (\(F_v\)). When an antibody underperforms in wet-lab characterization, engineers use Surface Properties to pinpoint the exact residues to mutate while referencing paratope contact predictions to preserve antigen binding.
Why Surface Properties Functions as a Mutation Guide Rather Than an Assay Predictor
In silico developability tools often struggle when attempting continuous quantitative predictions of experimental assay readouts:
- Viscosity is an Emergent Multi-Body Phenomenon: High-concentration viscosity (\(>100\text{--}150\text{ mg/mL}\)) is governed by transient, shear-dependent percolation networks, intermolecular collisions, Fab-Fc contacts, and hinge flexibility. At high concentrations, antibody molecules are separated by less than a molecular diameter. Predicting concentrated solution rheology from a static, monomeric \(F_v\) structure fails to capture these dynamics. Furthermore, viscosity is intensely sensitive to formulation: a \(0.3\)-unit pH shift or adding \(50\text{ mM}\) Arg-HCl can drop viscosity from \(85\text{ cP}\) to \(14\text{ cP}\) without altering a single amino acid.
- HIC Operates Under Salt-Induced Conformational Stress: Hydrophobic Interaction Chromatography (HIC) retention is measured under steep ammonium sulfate gradients (\(1.5\text{--}2.0\text{ M } (\text{NH}_4)_2\text{SO}_4\)). High lyotropic salt alters water structure, destabilizes flexible loops (particularly CDR-H3), and exposes cryptic hydrophobic residues that do not appear exposed in dilute solution or static homology models.
Because continuous numerical models provide false precision, AbLead focuses on structural hazard identification: mapping the physical clusters on the 3D surface so engineers know exactly which residues to substitute to remediate developability liabilities.
Accessing the Tool
Select exactly one antibody in the Project View that has an associated structure model. Open the Analysis menu and select Surface Properties. This opens the Surface Properties workspace in a new tab.
This analysis provides residue-level details for SPH (Surface Hydrophobicity), SPP (Positive Patch Charge), SPN (Negative Patch Charge), and SPCD (Charge Dipole Asymmetry) scores.
Users can select chain modes (Fv, VL Only, or VH Only) to see how surface properties change in an isolated chain format, and toggle residue rows in the grids to highlight the residue and its 3D neighbors on the molecular structure.
Engineering anomalous surface regions improves antibody developability
Highly exposed hydrophobic clusters and dense surface charge patches are key drivers of poor antibody developability. By identifying these undesired regions, developers can design targeted mutations to optimize the surface profile:
- Hydrophobic Patches (High SPH): Exposed hydrophobic clusters on the variable domain surface drive self-association, reversible aggregation, low solubility, and accelerated clearance. Mutating exposed hydrophobic residues (such as Ile, Leu, Val, and Phe) to hydrophilic residues (such as Ser and Thr) dramatically improves solubility and biophysical stability without compromising binding affinity when non-paratope positions are selected.
- Positive Charge Patches (High SPP): Large, concentrated positive surface charge patches promote non-specific interactions with negatively charged cell membranes, heparin, and serum components, leading to accelerated systemic clearance and poor pharmacokinetics. Introducing neutral or acidic substitutions disperses the charge cluster. See Liu et al. regarding clearance.
- Negative Charge Patches (High SPN): Concentrated negative surface charge patches can lead to electrostatic repulsion, phase separation, or self-association under specific buffer conditions. Neutralizing these patches by mutating charged residues to neutral amino acids restores a balanced electrostatic surface.
- Charge Dipole Asymmetry (Extreme SPCD): When one variable domain is strongly basic and the partner domain is acidic, intermolecular electrostatic attraction between opposite domains can lead to head-to-tail lattice formation and high viscosity at high concentration. Balancing net domain charges remediates these electrostatic networks. See Agrawal et al. regarding viscosity.
- Isolated Domain Liabilities: In single-chain or monomeric formats (such as scFvs or nanobodies), the variable domain interface is exposed to solvent. Interface residues are naturally hydrophobic and optimized for inter-chain packing, representing severe liabilities when exposed. Evaluating and engineering these isolated regions is critical to prevent aggregation of non-Fv formats.
Surface Property Metrics Table
The following table summarizes the surface property metrics computed by AbLead, based on relative solvent accessibility and spatial neighborhoods.
| Metric | Name | Severity Cutoff | Calculation Basis | Engineering Description |
|---|---|---|---|---|
| SPH | Surface Hydrophobicity | \(\ge 4.0\) (High/Red) | Eisenberg Hydrophobicity Scale | Measures the exposure of clustered hydrophobic residues. High SPH indicates large hydrophobic clusters that drive aggregation, self-association, or elevated HIC retention. Target for mutation to polar residues (Ser, Thr). |
| SPP | Positive Charge Patch | \(\ge 2.0\) (High/Red) | Lys, Arg, His positive charges | Evaluates the density of positively charged patches on the surface. Excessive positive charge density drives fast clearance and non-specific binding. Target for neutralization. |
| SPN | Negative Charge Patch | \(\ge 2.0\) (High/Red) | Asp, Glu negative charges | Evaluates the density of negatively charged patches on the surface. High negative patches influence solubility, pI, and electrostatic stability. Target for neutralization. |
| SPCD | Charge Dipole Asymmetry | N/A (Distribution metric) | VL/VH exposed charge product | Measures Fv charge distribution asymmetry (\(q_{VL} \times q_{VH}\) at pH 5.5). Extreme negative values indicate opposing domain polarities that can drive head-to-tail viscosity networks. |
Stability and Property Cutoffs
Due to differences in biophysical impact and scale calibration, the recommended thresholds for identifying surface developability hotspots are:
- SPH (Surface Hydrophobicity): Recommended cutoff is
4.0(Severe/Red). Residues exceeding this value are major hydrophobic hotspots and primary targets for solubilizing mutations. - SPP (Positive Patch): Recommended cutoff is
2.0(Severe/Red). Residues exceeding this value represent highly positive local environments that promote non-specific tissue binding. - SPN (Negative Patch): Recommended cutoff is
2.0(Severe/Red). Residues exceeding this value represent highly negative local environments. - SPCD (Charge Dipole Asymmetry): Because SPCD is a global distribution metric reflecting inter-chain polarization, it does not have a discrete per-residue severity cutoff. It is used to analyze overall antibody dipole asymmetry.
The Calculation Method
Properties are calculated on the fly using structural coordinates:
- Structure Cleaning: Hydrogen atoms and heteroatoms (solvent water) are detached from the parsed PDB model.
- SASA Calculation: Solvent accessible surface area (SASA) is computed for all atoms using the Shrake-Rupley algorithm (probe radius 1.40 Å, Richards atomic radii).
- Exposure Cutoff: Residues are classified as exposed if their relative solvent accessibility (RSA) is at least \(7.5\%\) (\(\text{RSA} \ge 0.075\)).
- Salt Bridge Neutralization: If two exposed residues form a salt bridge (distance between opposite charge centers \(\le 4.0\) Å), their hydrophobic and charge contributions are neutralized (set to \(0.0\)).
- Score Accumulation: Per-residue scores sum the contributions of all other exposed neighbor residues within a spatial cutoff distance of 7.5 Å (heavy-atom closest approach) using a distance-dependent decay:
where \(d_{\text{res}, j}\) is the closest heavy-atom distance, and \(\text{Scale}\) is the normalized hydrophobicity or charge property scale. Overall scores represent the sum of all individual residue-pair interactions. Note that SPCD uses a specific charge scale calibrated at pH 5.5 (setting Histidine to \(+0.9\)) to match standard FvCSP/SFvCSP definitions.
See Raybould et al. for background on structural developability profiling.
Recalculating for Single Chains
In the Fv complex, the variable light (VL) and variable heavy (VH) domains interface tightly, burying contact residues at the interface.
To evaluate developability properties in formats where a chain is isolated (such as single-chain Fvs or variable domain monomers), users can change the Chains Display setting to VL Only (Interface exposed) or VH Only (Interface exposed).
- Isolated Calculations: The unselected chain is detached from a structure copy in the backend prior to executing the Shrake-Rupley SASA calculations. This exposes the interface residues, enabling their properties to be evaluated in their isolated state.
- Main Structure Preservation: The unselected chain ribbon cartoon remains visible in the Molstar viewer (unless "Show Both Chains" is unchecked) to provide structural context, but its sidechains are not colored by property.
- Dual Grid Presentation: Both VL and VH grids remain visible. The active chain displays its isolated recalculated properties, while the inactive chain continues to display its standard Fv baseline properties.
Using the Tool
-
Settings
- Display Property: Select SPH, SPP, SPN, or SPCD to display.
- Chains Display: Select Fv (VL and VH), VL Only (Interface exposed), or VH Only (Interface exposed) calculations.
- Show Both Chains: Toggle whether to show the non-selected chain ribbon cartoon in the 3D viewer.
- Select Severe: Selects residues exceeding developability hotspot risk thresholds (\(\text{SPH} \ge 4.0\), \(\text{SPP} \ge 2.0\), \(\text{SPN} \ge 2.0\)). Disabled for SPCD since SPCD is a distribution metric with no discrete residue-level severity scale.
- Spacefill Selected: Toggles whether selected residues are shown as spacefill spheres in the 3D viewer.
- Color Legends: Details the property scales, ABHAND amino acid colors, region colors, and predicted paratope contact categories.
- Mutation Guide: Click the Mutation Guide button in the top toolbar to view a reference modal detailing triage thresholds, remediation strategies, and paratope preservation tips.
-
Sequence Aligner Track: Visualizes variable domain sequences colored by the selected property scale. Rotated system numbering is shown above, followed by the region assignment bar and a skinny Predicted Paratope track colored by Paragraph antigen-binding contact probability: Contact (\(\ge 50\%\), deep blue), Intermediate (\(20\%–49\%\), light blue), or Low/Non-contact (\(< 20\%\), light slate). Hovering over a residue displays a tooltip listing its SPH, SPP, SPN, and SPCD values alongside its 3D spatial neighbors, and hovering over the paratope row displays contact probability percentages and classification. Clicking a paratope cell or residue letter smoothly scrolls the corresponding residue data grid to focus on that position.
-
Residue Data Grids: Detailed residue-level property tables for both the VL and VH domains are kept side-by-side at all times. A bold
Pbadge is appended to the Region column for residues with predicted paratope contact probability \(\ge 50\%\) to quickly indicate antigen-binding involvement when prioritizing engineering edits. Clicking a row highlights the residue in the 3D viewer, and clicking a residue letter in the aligner track scrolls the grid to focus on that position. -
Indicator Dots: Dynamic mutation (squares) and observation (circles) indicators are rendered directly on the residue cells. Clicking a residue letter in the grids opens the Engineering / Observations modal to save or edit mutation designs, instantly refreshing the layout.
-
3D Viewer and Neighborhood Highlighting: Displays the Fv structure ribbon backbone colored by region. Sidechain atoms for exposed or selected residues are shown colored by their property scores. Selecting any residue in the sequence or grid highlights the residue and all of its 3D spatial neighbors (heavy-atom distance \(\le 7.5\) Å) in the viewer as sidechain ball-and-stick representations. If Spacefill Selected is checked, selected residues are shown as spacefill spheres, and static labels formatted as
[Neighbor <imgt>] <AA>are added to the neighbors. -
Export Excel: Generates a single-worksheet spreadsheet containing mature linear numbering, residue regions (colored by region scheme), amino acid classes (colored by ABHAND), and property values. Zero-value cells (
0.0) are left uncolored to reduce clutter, and the "3D Neighbors" list is left-aligned with text wrapping disabled. -
Export PyMOL (.py): Generates a self-contained PyMOL Python script (
.py) matching the currently selected Display Property (SPH, SPP, SPN, or SPCD) and Chains Display parameters. Executing the script inside PyMOL:- Creates and groups region sets (selections for CDRs and Frameworks) matching Liabilities.
- Colors all cartoon and surface representations to the metric's baseline color.
- Individually colors residues with active metric values by their property scores and displays their sidechains as sticks.
- Renders a solid, opaque surface (
transparency 0.0) over the active chain(s). - Hides all stick/line representations of hydrogen atoms while preserving their physical volume contribution to the calculated surface shape.
References
- The PDB structure viewer is provided by Mol*.
- The background inspiration for the Surface Properties (Tap-like method) is described in Raybould et al., PNAS (2019).
- Paragraph paratope prediction is described in Chinery et al., Bioinformatics (2021).
- Liu, Shufang, Ashwni Verma, Hubert Kettenberger, Wolfgang F. Richter, and Dhaval K. Shah. “Effect of Variable Domain Charge on in Vitro and in Vivo Disposition of Monoclonal Antibodies.” mAbs 13, no. 1 (2021): 1993769.
- Agrawal, Neeraj J., Bernhard Helk, Sandeep Kumar, et al. “Computational Tool for the Early Screening of Monoclonal Antibodies for Their Viscosities.” mAbs 0862, no. December (2015): 1–6.