Solvent Exposures
Evaluates the solvent accessibility of antibody residues using the Shrake-Rupley algorithm to calculate the Solvent Accessible Surface Area (SASA).
This tool provides a granular, residue-level view of surface exposures, helping identify specific regions or residues that are highly exposed to the solvent and could potentially impact developability, aggregation, or solubility, as well as aiding the engineering of other liabilities.
You could always do solvent exposure calculations in a nother tool, export those to a file, and shift between environments to evaluate solvent exposed residues and atoms, but Be Inherently Lazy and let the tool do this for you.
Accessing the Tool
Select a single antibody which has an associated PDB file in the Project View. Go to the Analysis menu and select Solvent Exposures. This will open the Solvent Exposures workspace.
Using the Tool
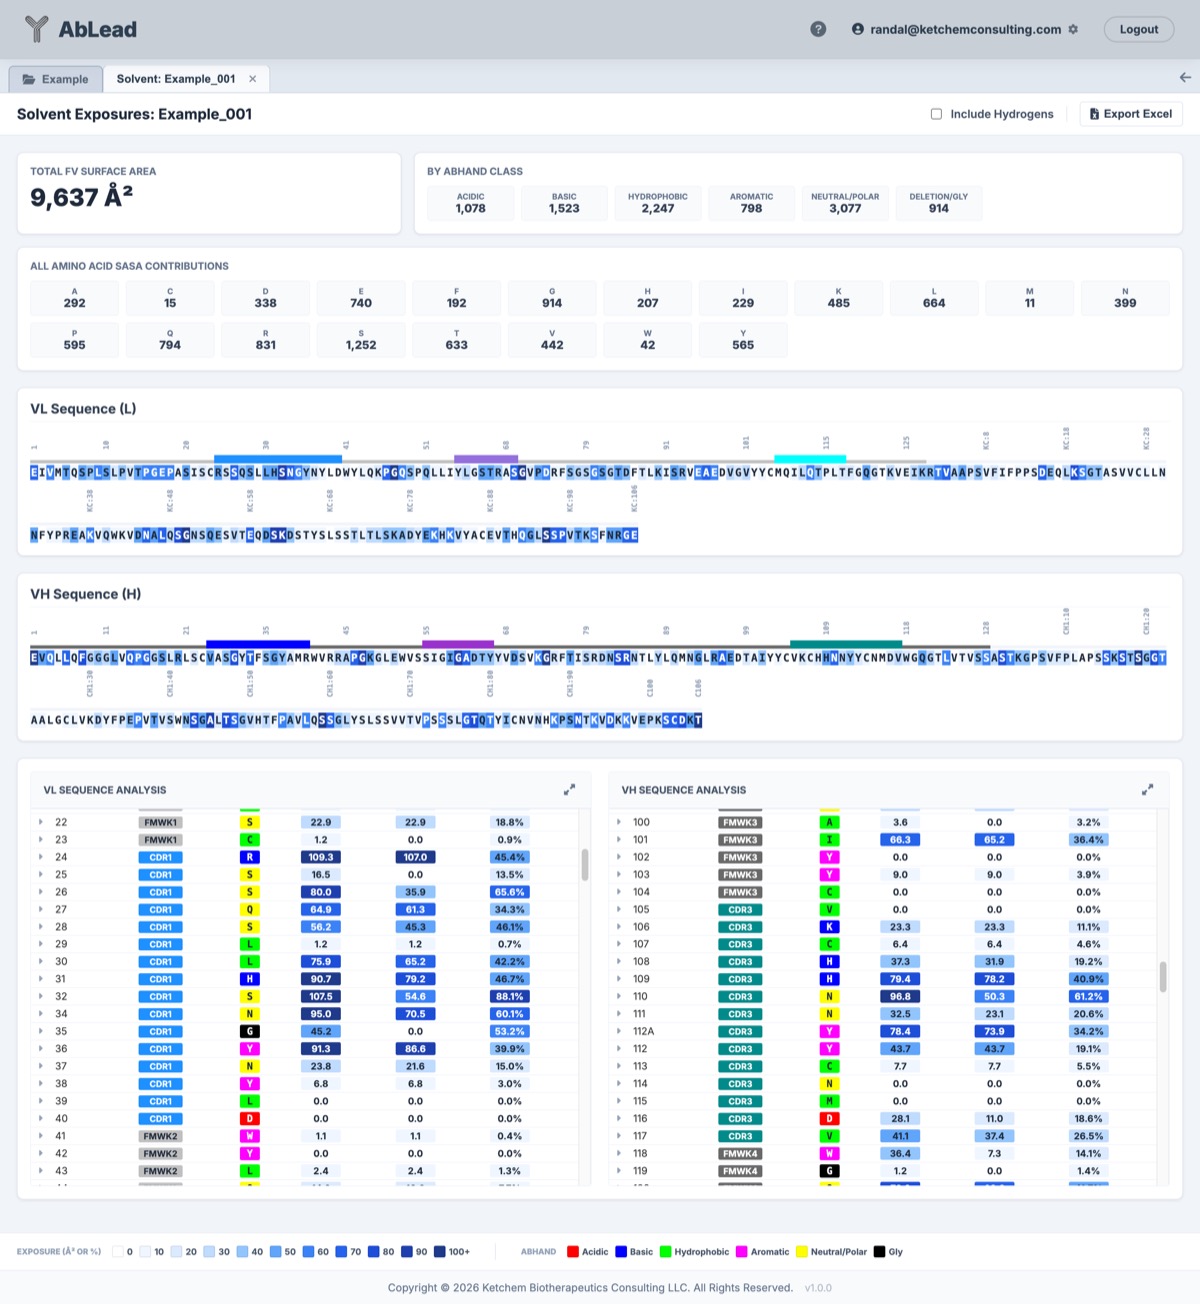
The Solvent Exposures workspace provides an aggregate view of antibody surface metrics alongside granular residue-level diagnostics. Note that solvent exposures are only calculated for residues present in the input PDB structure.
Export Excel: Click on the Export Excel button to export the solvent exposure analysis to an Excel file.
1. Aggregate Values
Note: All aggregate values are dependent on the input PDB structure and may not represent the full-length antibody. The values shown are for the Fv region only, but calculated in the presence of the complete input structure.
- Total Surface Area: The total accessible surface area (in Ų) across the Fv region.
- By ABHAND Class: A breakdown of the total SASA contributed by different chemical classes (Acidic, Basic, Hydrophobic, Aromatic, Neutral/Polar, Deletion/Gly).
- All Amino Acid SASA Contributions: A breakdown of the SASA contributed by each specific amino acid type present in the sequence.
2. Sequence View
- Residue Boxes: Colored based on relative Solvent Accessible Surface Area (rASA). Darker blue indicates higher exposure to the solvent.
- Region Bars: CDRs and Frameworks are annotated above the sequence with respective colors.
- Tooltips: Hover over any residue to see its total SASA (Ų), side-chain SASA (scASA in Ų), and relative ASA (rASA %). Clicking on a residue scrolls to its corresponding row in the detail table.
3. Residue-Level Analysis (Dual-Pane)
The table at the bottom provides a comprehensive diagnostic view for every residue in the Fv domain, separated by chain (VL and VH).
- SASA: Total Solvent Accessible Surface Area of the residue in Ų.
- scASA: Side-chain Accessible Surface Area of the residue in Ų.
- rASA: Relative Accessible Surface Area (percentage of the maximum possible exposure for that amino acid type).
- Expand Icon: Click the icon to the left of the residue (or the header icon for the entire chain) to toggle the visibility of atom-level details for that residue. When expanded, the icon rotates to indicate that the details are visible.
- Residue Position Evaluation: Select a residue column to display the position on the structure.
Strategy: Used in conjunction with other tools such as Liabilities, Humanness, Engineering, etc. to determine potential residue-level impacts on developability.
Coloring and Interpretations
AbLead uses a blue intensity scale to categorize solvent exposure (Ų or percentages):
| Exposure (Ų or %) | UI Color (Hex) |
|---|---|
| 0 | #ffffff |
| 10 | #eff6ff |
| 20 | #dbeafe |
| 30 | #bfdbfe |
| 40 | #93c5fd |
| 50 | #60a5fa |
| 60 | #3b82f6 |
| 70 | #2563eb |
| 80 | #1d4ed8 |
| 90 | #1e40af |
| 100+ | #1e3a8a |
Methodology
- Shrake-Rupley Algorithm: Computes SASA by generating a mesh of points around each atom and determining which points are solvent-accessible.
- Hydrogen Removal: Hydrogens are explicitly removed from the structure prior to calculation; only heavy atoms are considered in the accessibility calculation.
References
- The SASA calculation uses the
Bio.PDB.SASAmodule from Biopython, implementing the Shrake-Rupley algorithm.