Germline Analysis
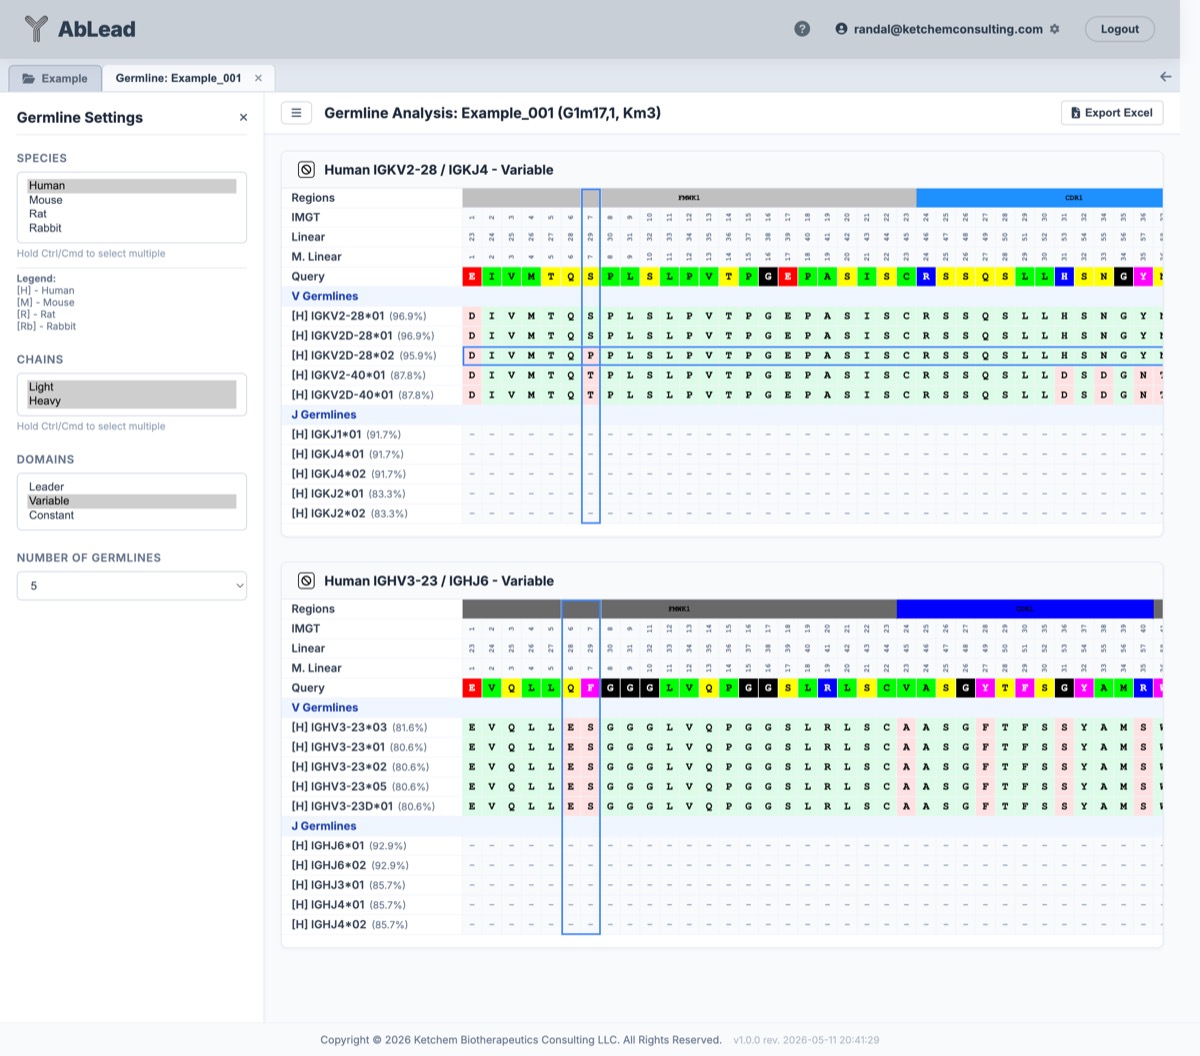
View the sequence broken into Leader, Variable (V and J), and Constant regions, with top germline hits aligned below.
This tool is helpful in the evaluation of germline origins, identifying V and J gene assignments, and assessing the alignment of leader and constant domains against reference sequences.
Accessing the Tool
Select an entry in the Project View. Go to the Analysis menu and select Germline. This will open the Germline workspace in a new tab.
Using the Tool
- Leader Section: Displays the best matching Leader sequence found via sliding identity search against the reference database, aligned with the query sequence.
- Variable Section: Displays the sequence broken into V and J regions with their top germline hits aligned below. A dedicated Liabilities row is displayed directly above the Query sequence row, matching the presentation in the PFA tool. The row highlights sequence liabilities (deamidation, isomerization, cleavage, glycosylation, oxidation, disrupted CDR3 salt bridges) and language model framework/stability penalties (AbLang, AbLang2, IgBert, and CVV). Positions with severe language model score differences are annotated with an S indicator, and hovering over any liability cell displays a detailed tooltip listing all detected liabilities and scores. Candidate germlines are ranked primarily by Framework (FR1–FR3 for V, FR4 for J) sequence identity, using Framework ABHAND sequence homology as a secondary tie-breaker, followed by Full V-domain identity and homology. Both identity and homology percentage scores are displayed side-by-side in each germline row label badge (e.g.,
(78.4% / 84.5% Hom)). When multiple species are selected, a species indicator badge (e.g.,Hfor Human,Rhfor Rhesus,Mfor Mouse) is shown next to the germline name. -
Settings Panel: Use the sidebar on the left to customize the workspace display:
- Species: Filter by reference species (Human, Mouse, Alpaca, Cat, Dog, Pig, Rabbit, Rat, Rhesus, Chicken).
- Chains: Toggle Light and Heavy chains.
- Domains: Select which domains to view (Leader, Variable, Constant).
- Sort By: Toggle ranking of candidate germlines between Framework Residues (default; evaluates framework positions FR1–FR3 for V and FR4 for J) and Full Sequence (evaluates IMGT positions 1 to 108).
- Number of Germlines: Choose how many germline hits to display per group (1, 3, 5, 10, 20, or All).
- Selected Residue Style: Switch 3D highlighted residue rendering between Spacefill and Ball-and-Stick.
- Liability Color Lookup: The settings sidebar includes a reference card displaying active liability color swatches, full liability names, and explanatory notes on motif start residue highlighting and severe language model thresholds.
-
Constant Section: Displays the best matching Constant domains (e.g., CH1, Hinge, CH2, CH3 for Heavy chain, or KC/LC for Light chain) aligned with the query sequence.
- Excel Export: Click the Export Excel button in the toolbar to export the current view, liabilities, and alignments to a spreadsheet.
- Engineering Mutation Designs: Click a residue to enter a mutation design used by the Engineering tab.
- Observations: Click a residue to enter an observation for that IMGT position. These are displayed in the Observations tab and on a clicked residue.
- Indicator Dots: Dots on a residue position indicate that there is an associated engineering design or observation at that position. Engineering mutations will appear as a small eggshell square while observations will appear as a small orange circle.
Supported Reference Species
The Germline tool matches sequences against reference databases compiled from the following species:
| Scientific Name | Common Name (AbLead Badge) |
|---|---|
| Homo sapiens | Human (H) |
| Macaca mulatta | Rhesus (Rh) |
| Mus musculus | Mouse (M) |
| Rattus norvegicus | Rat (R) |
| Oryctolagus cuniculus | Rabbit (Rb) |
| Vicugna pacos | Alpaca (Al) |
| Canis lupus familiaris | Dog (Dg) |
| Felis catus | Cat (Ct) |
| Gallus gallus | Chicken (Ck) |
| Sus scrofa | Pig (Pg) |
Allotype Detection
The Germline tool automatically detects allotypes and isotypes based on specific amino acid residues in the constant domains using the EU numbering system. The detected allotypes are displayed in the page title next to the antibody name (e.g., Germline Analysis: [Name] (G1m17,1, Km3)).
Supported Allotypes and Isotypes
| Chain | Class/Subclass | Allotype/Isotype | EU Positions & Residues | Human Prevalence |
|---|---|---|---|---|
| Heavy | IgG1 | G1m17 |
CH1 214 = K | Cau: 15-35%, As: ~100%, Afr: ~100% |
G1m3 |
CH1 214 = R | Cau: 65-85%, As: ~0%, Afr: ~0% | ||
G1m1 |
CH3 356 = D, 358 = L | Cau: 35-40%, As: ~100%, Afr: ~100% | ||
G1m2 |
CH3 431 = G | Cau: 10-15%, As: <10%, Afr: <10% | ||
| IgG2 | G2m23 |
CH1 189 = T AND CH2 282 = M | Cau: ~50%, As: ~25%, Afr: ~25% | |
| Light | Kappa | Km1 |
KC 153 = V, 191 = L | Cau: 10-15%, As: ~30%, Afr: ~30% |
Km1,2 |
KC 153 = A, 191 = L | Rare in all populations | ||
Km3 |
KC 153 = A, 191 = V | Cau: 85-90%, As: ~70%, Afr: ~70% | ||
| Lambda | Mcg+ |
LC 112 = N, 114 = T | Isotypic marker (IGLC1) | |
Kern+ |
LC 152 = G | Isotypic marker (IGLC2/IGLC3 variant) | ||
Oz+ |
LC 190 = K | Isotypic marker (IGLC2 variant) |
Note: IgG1 markers are combined using standard notation (e.g., G1m17 + G1m1 -> G1m17,1). Prevalence values are approximate (Cau: Caucasian, As: Asian, Afr: African) and vary by specific ethnic sub-populations.
3D Structure Visualization & Residue Selection
The Germline workspace includes an interactive PDBe Mol* 3D structure viewer positioned below the grids, allowing real-time mapping of sequence changes to the three-dimensional antibody structure.
-
Interactive Resizer: Drag the horizontal divider bar directly above the 3D window up or down to adjust the vertical height of the viewer pane.
-
Cartoon Region Coloring: The ribbon structures of the light and heavy chains are colored by region to match the centralized color schemes:
- Variable Domain (Fv): Frameworks (dim gray/silver) and CDRs (blues, purples, cyans) are colored according to domain region standards.
- Constant Domains: Reconstructed constant domains (CL, CH1, hinge, CH2, CH3) are automatically rendered and colored by their specific sub-domain region colors.
-
Selected Residue Highlighting:
- Clicking column headers in the alignment grids (scheme position or linear number) highlights those columns in blue.
- The corresponding residues on the 3D structure are instantly highlighted in CPK element coloring (with position number labels), regardless of which exclusion method is active.
- Residue Style: Toggle the dropdown to change the rendering style of selected residues between Spacefill (default) and Ball-and-Stick.
References
- Jefferis R, Lefranc MP. Human immunoglobulin allotypes: Possible implications for immunogenicity. mAbs. 2009 Jul-Aug;1(4):310-8. doi: 10.4161/mabs.1.4.9122.
- Lefranc M-P, Lefranc G. Human Gm, Km, and Am allotypes and their molecular characterization: a remarkable demonstration of polymorphism. Methods Mol Biol. 2012;882:635-80. doi: 10.1007/978-1-61779-842-9_34.