Project View
The Project View provides a summary of all antibodies in the project.
Rather than pulling all of these analyses together manually and building a speadsheet in order to rank order a discovery set and focus on lead selection and optimization, follow my core work principle and Be Inherently Lazy. Pull together your analyses into a single analysis tool and run the tool to do the hard work for you.
Results Grid Columns
-
Interactive Multi-Column Sorting and Filtering: The results grid features an interactive multi-column composite sorting engine, context-sensitive popover filtering, and a unified active status banner:
-
Interactive Multi-Column Sort: Clicking any column header adds it to the sorting hierarchy. The most recently clicked column becomes the Primary Sort Key (Rank 1), while previously sorted columns remain active as Secondary and Tertiary tiebreakers (Rank 2, Rank 3, etc.). For example, clicking
KBC Scoreand thenLineagegroups candidates by Lineage and orders them within each lineage by their KBC Score. -
3-Way Sort Cycle: Each column header toggles through a three-state cycle upon consecutive clicks:
- Ascending (\(\blacktriangle\)): Sorts values from lowest to highest (or A to Z).
- Descending (\(\blacktriangledown\)): Sorts values from highest to lowest (or Z to A) and promotes the column to primary sort key.
- Default / Remove: Removes the column from the active sort stack. When all columns are removed, the grid restores its default natural order.
-
Precedence Rank Badges: When two or more columns are sorted simultaneously, small numbered badges (
1,2,3...) appear directly next to the sort arrows to visually communicate the exact sorting precedence. When only a single column is sorted, it renders as a clean, un-badged sort arrow. -
Column Filtering and Google-Norm Search Syntax: Click the filter icon in any column header to open an interactive popover filter. The column filtering engine supports Google-norm negation syntax, exact literal quotation matching, comma-separated hybrid queries, relational comparisons, and numerical ranges:
-
Google-Norm Negation (
-andNOT): Prepend a hyphen or minus sign (e.g.-rhesusor-high) or use theNOTkeyword (e.g.NOT rhesus) to exclude candidates matching that term. This is particularly useful for filtering out non-human species from auto-detected columns, excluding high-risk liability tiers, or omitting specific clone families. Developer negation operators (!=and!) are also supported (e.g.!= Humanor!mouse). -
Exact Literal Matching in Quotation Marks (
"..."): Wrap terms in double quotation marks (e.g."-rhesus") to search for literal hyphens or exact character sequences without triggering negation mode. -
Comma-Separated Hybrid Matching: Enter multiple values separated by commas to combine positive and negative criteria. Positive terms are evaluated using logical OR, while negative terms are evaluated using logical AND exclusions. For example,
human, mouse, -rhesuswill match any candidate whose species is either human or mouse, while strictly excluding any candidate containing rhesus. -
Relational Comparison Operators: Filter numeric columns using relational operators:
>,>=,<,<=, and=(e.g.> 10,<= 5.5, or= 4.58). -
Numerical Value Ranges: Specify a range using a hyphen between two numbers (e.g.
5.5 - 7.5or10-20) to display candidates with values falling between the lower and upper bounds inclusive. -
Protected Candidate Names: Entry Name columns enforce strict natural alphanumeric string sorting and case-insensitive substring filtering, ensuring hyphenated clone identifiers, numbered clone codes, or alphanumeric prefixes are never coerced into numbers.
-
-
Active Status Banner and Interactive Chips: Whenever column filters or sorts are active, a dedicated status banner is displayed directly above the table:
- Active Filter Chips: Rendered as blue chips with the column name, criteria, and a removal button (\(\times\)).
- Active Sort Chips: Rendered alongside active filters, displaying the column name, sort direction icon (\(\uparrow\) or \(\downarrow\)), composite multi-sort priority badges (
1,2, etc.), and an individual removal button (\(\times\)) to remove single sorts from the hierarchy. - Unified Clear All: Clicking the Clear All button in the banner clears all active column filters and column sorts simultaneously, restoring initial table order and collapsing the status banner.
-
State Persistence: Active sort stacks and filter criteria are stored in browser session storage (
sessionStorage), automatically preserving your sort hierarchy and view state across tab navigation, sequence edits, and page reloads.
-
-
Name: The entry name associated with the analysis. Names may be double-clicked to be edited. If the entry name background is light red, it means that no PDB structure is available for that entry. If the cell contains a small eggshell square in the upper right corner, it means that the entry has engineering mutations.
-
If the entry is a T-cell receptor (TCR), a teal TCR badge is displayed directly next to the clone name in the Name cell.
-
If the entry name is styled in red font, it indicates that the calculation is outdated based on a change in a method or the introduction of a new method which would change the values in the results grid. To update the calculation and restore the font to standard black, select the entry or entries and perform an Analysis > Full Re-run Analysis.
-
If the entry is a Multispecific (has been through the Assembler), it will have a label 'Multispecific' and the analyses will not have been run. To see the individual analyses, use Extract Fvs to create individual Fv entries in the project.
-
If the entry light chain has a constant domain, and is missing or has an extra junction residue, the entry name will be flagged with a descriptive warning stating one of 'Missing R', 'Extra R', 'Missing G', 'Extra G'. Use Edit > Repair Junction to correct these issues and automatically re-run the analysis.
-
-
Registry (
Full LengthandMature): Located immediately to the right of the Name column, the Registry section displays two deterministic, company-scoped sequence registry identifiers for every entry:- Full Length (
F-#): A sequential identifier (F-1,F-2, etc., with no leading zeros) assigned to the unique combination of full-length chain amino acid sequences (including signal peptide leaders) and chain stoichiometry within your organization. - Mature (
M-#): A sequential identifier (M-1,M-2, etc., with no leading zeros) assigned to the unique combination of mature chain amino acid sequences (after signal peptide leader trimming) and chain stoichiometry within your organization. Two entries that share the same mature sequence and stoichiometry but use different signal peptide leaders will receive distinct Full-Length IDs (F-1andF-2) while sharing the same Mature ID (M-1). Entries uploaded without a leader sequence still receive bothF-#andM-#identifiers. - Stoichiometry-Aware Deterministic Hashing: Behind the scenes, each chain sequence is duplicated by its integer copy count (Light Chain copies and Heavy Chain copies, or per-chain copies for multispecifics), sorted lexicographically, and hashed with the organization's immutable numeric Company ID (
company:<id>) using a 64-character SHA-256 digest. Renaming a company never alters existing Registry IDs or counters, and cross-organization hash collisions are prevented. - Name Convention Selector (
Common Name,Mature ID (M-#),Full-Length ID (F-#)): Use the Name Convention dropdown in the Project View Presets menu to switch on the fly between displaying Common Names, Mature IDs (M-#), or Full-Length IDs (F-#) across downstream analysis and export tools (Alignment, Clading, Liabilities, Germline, Humanness, PFA, Covariance, Surface Properties, Sequence View, and Plot Results). When two entries in the same project share a Mature ID with different leaders, AbLead automatically disambiguates them asM-1 (F-1)andM-1 (F-2).
- Full Length (
-
Lineage: The parent of the entry. If the entry is a variant, the parent is the antibody it was derived from. These may be set by the user, but are automatically set for Engineering builds.
-
Genetic Origin: The genetic origin and species of the antibody or TCR chains (e.g., Human, Mouse, Rhesus, Dog, Pig, Rabbit, Rat, Alpaca, Cat, Chicken). Germline gene and species assignments are determined through a multi-tier hierarchy against the platform's reference database:
- Framework-First Matching: Candidate V-genes are ranked primarily by sequence identity across framework positions (FR1–FR3: IMGT 1–26, 39–55, 66–104) and J-genes across FR4 (IMGT 118–128), preventing false species classifications caused by grafted or affinity-matured CDR loops. For TCR sequences, candidates are mapped against reference TCR V and J alleles (
TRAV/TRAJ,TRBV/TRBJ,TRGV/TRGJ,TRDV/TRDJ). - ABHAND Sequence Homology: Within identical framework identity scores, conservative amino acid substitutions are evaluated using canonical ABHAND chemical property groupings (Acidic, Basic, Aliphatic/Hydrophobic, Aromatic, Neutral/Polar, Small/Conformation) as an automated secondary tie-breaker.
- Full-Length & Human Preference: Full V-domain identity (positions 1–104) and homology serve as tertiary tie-breakers, followed by human species preference on exact ties.
- Visual Highlighting: Non-human sequences are highlighted with a light orange background. Kappa VLs are shown in light Kobicha and Lambda VLs are shown in light Lavender.
[!NOTE] CDR3 Junction Exclusion: In the Project View, V-gene assignment and species identification ignore the hypervariable CDR3 junction region (evaluating IMGT positions 1 to 104). In the detailed Germline workspace, users can switch between Framework Residues (default) and Full Sequence (positions 1 to 108) alignment views.
- Framework-First Matching: Candidate V-genes are ranked primarily by sequence identity across framework positions (FR1–FR3: IMGT 1–26, 39–55, 66–104) and J-genes across FR4 (IMGT 118–128), preventing false species classifications caused by grafted or affinity-matured CDR loops. For TCR sequences, candidates are mapped against reference TCR V and J alleles (
-
Nearest Neighbor: The closest sequence to that entry within the set. This is a simple depiction of set diversity. Clading provides a more detailed view of set diversity.
- Alignment: The residues for each antibody's variable light (VL) and variable heavy (VH) chains are aligned according to the selected numbering scheme (e.g., IMGT, Kabat, AHo, or Martin).
- Merging: The aligned VL and VH positions are merged to represent the full variable fragment (Fv).
- Distance Calculation: The sequence distance (p-distance) is calculated between every pair of antibodies in the project using the formula: \(\text{Distance} = 100 \times (1 - \text{Percent Identity})\)
- Comparable Length: The comparable length (denominator) is the sum of the positions present in the union of both sequences for both chains.
- Identification: For each entry, the antibody that yields the lowest distance is identified as its Nearest Neighbor.
-
CDR Length: The measured sequence lengths, as well as the summed total, for the CDRs based on the defined region scheme.
-
Stability
-
AbLang, AbLang2, and IgBert: Summed LLM likelihood differences between the parent and most likely residues at each position for full-length sequence and framework positions only. AbLang is a broader LLM while AbLang2 and IgBert remove germline bias. Scoring is based on natural antibody distributions. See AbLang, AbLang2, and IgBert.
[!NOTE] Single-Chain (VHH / Nanobody) Exception: Since both AbLang2 and IgBert are executed in paired-chain mode, they require both the heavy and light variable domain sequences to perform calculations. When single-chain sequences (like VHH) are analyzed, these models cannot execute and their values are reported as
NC(Not Calculated) rather than defaulting to0.00. The original AbLang model is run in single-chain mode and will still compute scores for heavy-chain-only inputs.[!NOTE] TCR Sequences Exception: AbLang, AbLang2, and IgBert are antibody-specific language models trained on natural immunoglobulin repertoires. For T-cell receptor (TCR) sequences, these models are not applicable and are reported as
NC(Not Calculated). -
Disrupted CDR3 Salt Bridge: Identifies if the canonical HC-CDR3 salt bridge has been disrupted by mutation. This can impact fold stability.
-
-
Surface Properties
These are calculated similar to the OPIG TAP method.- SPH: Hydrophobicity character of the surface.
- SPP: Positive charge character of the surface.
- SPN: Negative charge character of the surface.
- SPCD: Fv charge interaction character of the surface.
-
Cysteines
- Cysteine Missing: Identifies if a normal Ig fold cysteine is missing from the sequence.
- Unusual Cysteine: Identifies cysteines in the sequence that are not in the normal Ig fold positions.
- Unpaired Cysteine: Identifies unpaired cysteines in the sequence. After structure evaluation this count may be modified directly in the grid or in the Excel export to lower the score (lower is better). Performing a "Full Re-run Analysis" on the entry will reset the value.
-
Potential PTMs
See LAP: Liability Antibody Profiler by sequence & structural mapping of natural and therapeutic antibodies. Detailed descriptions of these motifs are available in the Satlawa Liabilities Table.- Deamidation and Isomerization: If these are realized over time they could degrade antigen binding.
- N-linked Glycosylation: Identifies potential glycosylation sites. While these could help solubilize the Fv, they may also impact affinity and efficacy if there are differences across productions.
- Met and Trp Oxidation: Methionine and Tryptophan residues are susceptible to oxidation. If realized over time they could degrade antigen binding.
- Hydrolysis: Creation from NP to DP during deamidation, which could then isomerize.
- Fragmentation: Potential cleavage between defined residues.
-
Humanness
A measure of the VL, VH, and Fv humanness of the sequence.- Sapiens: Calculates the mean residue probability score across the variable domain using the Sapiens masked language model. Sapiens thresholds were calibrated using clinical trial anti-drug antibody (ADA) rates from the Immunogenicity Database Collaborative (IDC) dataset, where highly tolerated human therapeutics consistently score ≥ 0.85, whereas immunogenic/chimeric antibodies fall below 0.75.
- OASign: Calculates the percentage of 9-mers in the sequence that are present in a curated database derived from the Observed Antibody Space (OAS). A higher score indicates a more human sequence.
- RPEMHC: A first-principles biophysical MHC-II presentation and helper T-cell activation predictor utilizing a sliding 15-mer window over the Fv domain, weighted across 11 core human HLA-DRB1 alleles by their global population frequencies. Formatted as a 4-decimal probability float (\(0.0000 – 1.0000\)).
[!IMPORTANT] Integrated Immunogenicity Assessment: Sapiens, OASign, and RPEMHC must be evaluated in conjunction for a complete developability profile. OASign and Sapiens quantify sequence humanness (which corresponds to T-cell receptor self-tolerance), whereas RPEMHC predicts physical peptide presentation to human MHC-II. A therapeutic candidate is only safe if it scores well on both metrics: a "Good" (Green) RPEMHC score on a sequence with low humanness (such as a mouse sequence) is still highly immunogenic in patients because there is no self-tolerance for the presented peptides.
-
pI (Bjellqvist)
The theoretical isoelectric point (pI) of the antibody construct or Fv complex, calculated using the Bjellqvist method. The algorithm models the ionization states of all titratable amino acid side chains (Asp, Glu, Cys, Tyr, His, Lys, Arg) and sequence-dependent N- and C-terminal \(\text{p}K_a\) values across both chains, solving for the pH where the net molecular charge equals zero. -
Score
The score of the entry, calculated based on the analyses performed. This value may be used for rank ordering the set. The function used in the score calculation is exposed in the Excel output. The values and weights used for the KBC score may be customized in the KBC Scoring Preferences section. Users can save, rename, and manage multiple named scoring sets (presets) to dynamically apply different weight configurations. A permanent 'KBC Default' preset serves as the read-only baseline default. In custom presets, rules are fully customizable (you can add new rules for any biological/physical attribute, edit their operator conditions, and delete existing ones). Publishing new rules or deleting a rule will automatically save changes to the database instantly. The active scoring preset for each project can be selected directly using the Scoring dropdown menu in the project view toolbar. Projects default to 'KBC Default' (ignoring any active selection in Scoring Preferences) unless a custom preset is explicitly assigned to that project. If an assigned custom preset is deleted, the project reverts automatically to 'KBC Default'.[!TIP] Decomposing the KBC Score: To visually deconstruct candidate scores into their underlying category penalties (such as Stability, Humanness, or Potential PTMs), inspect itemized rule triggers, or export formatted score breakdown spreadsheets, see the Score Contribution Breakdown view in Plot Results.
-
Format Preferences & Presets
Conditional formatting ranges for all standard results columns (e.g., SPH, Sapiens, pI, CDR lengths, and liabilities) can be customized by navigating to Format Preferences in the user menu. Similar to Scoring Preferences, users can configure comparison operators, threshold values for Good, Low, Med, and High severities, and save them as named formatting sets. A read-only "KBC Default" preset serves as the baseline formatting template. Active formatting presets can be assigned to a project using the Format dropdown menu in the project view toolbar. Setting a format preset dynamically colors the results dashboard grid cells and applies corresponding native conditional formatting rules to Excel exports. If a custom formatting preset is deleted, projects using it automatically revert to "KBC Default".- Column Direction Indicators: Column titles in the results grid display directional indicator icons (
↓for lower is better,↑for higher is better) directly beside metric names. These icons dynamically adapt to reflect the target orientation configured in the active formatting preset (cond_good_opoperator), providing immediate visual feedback on whether lower or higher values represent desirable outcomes. - Continuous Color Scale Preferences (
Scale Colors): Each standard metric row includes a Scale Colors checkbox. When enabled, cell background colors continuously interpolate RGB gradients across defined severity level cutoffs (Good, Low, Med, High) on both the web dashboard grid and in native Excel (.xlsx) continuous color scale exports. For directional threshold metrics (e.g. KBC Score, SPH, AbLang, Sapiens), threshold cutoffs act as gradient anchors and intermediate values smoothly transition between tier colors. Rows configured with hardbetweenrange definitions (e.g., CDR lengths likeL1) preserve exact discrete tier colors for values falling inside defined range boundaries. - Master Header Select-All Toggle: The Scale Colors column header in Format Preferences features a global master toggle checkbox with Gmail-style tri-state deselect behavior (clicking when unchecked turns scaling on for all rows; clicking when checked or partially checked turns scaling off for all rows).
- Column Direction Indicators: Column titles in the results grid display directional indicator icons (
-
Notes
User-editable notes for each entry. Double-click the cell in the grid to edit. Notes are saved to the database and persisted across analysis re-runs and engineering modifications. They are also included in the Excel and CSV exports. -
Custom Metadata Columns
Users can upload or define custom metadata columns (such as assay data, affinity measurements, or internal identifiers) directly to the project view:- Upload Metadata: Available under Edit > Upload Metadata.... Matches uploaded row names against existing antibody entry names. Column types (text, integer, float) are automatically inferred, and scientific notation formats (e.g.,
32.4e-8) are normalized to standard scientific notation (e.g.,3.24e-7). - Overwrite Warnings: If the uploaded file contains columns that already exist in the project, a confirmation modal warning that "Duplicate columns will be overwritten" will appear. Click OK to overwrite the values or Cancel to not import.
-
Format & Renaming Settings: Click the settings gear icon in a custom column header to open the Format Settings modal. Here, you can rename the column title or configure the display format/notation:
- Text: Displays values as plain text.
- Integer: Displays values formatted as whole numbers.
- Decimal Float: Displays values formatted as decimals (e.g.,
%.2ffor two decimal places). - Scientific Notation: Displays values formatted in standard exponential notation (e.g.,
%e). - Custom: Allows you to enter a custom printf-style format string (e.g.,
%ior%.3f).
-
Conditional Formatting & Dynamic Indicators: Define severity threshold values (Good, Low, Med, High) to dynamically color cell backgrounds in both the results grid and the exported Excel spreadsheet (applied as native rules):
- Good: Green background.
- Low: Yellow background.
- Med: Orange background.
- High: Red background.
- Comparison Operators & Direction Indicators: Users can select explicit comparison operators (
>=,>,<=,<,=,!=) next to each threshold. When a directional operator (<=or<for lower is better;>=or>for higher is better) is chosen for the "Good" severity tier, a corresponding direction arrow icon (↓or↑) is dynamically applied to the custom column title header in the results grid. - Scale Colors Option: Check the "Scale colors between levels (Continuous Gradient)" option in the modal to continuously blend colors between defined threshold cutoffs instead of applying flat step tier colors.
-
Inline Editing: Double-click any custom metadata cell in the grid to edit its value directly. Cells dynamically recalculate and refresh their color and decimal formatting in real-time.
- Deleting Columns: Click the trash/delete icon in a custom column header to permanently delete the metadata column and its associated records from the project schema.
- Rearranging Columns: Drag and drop the column headers to rearrange the order of the columns.
- Upload Metadata: Available under Edit > Upload Metadata.... Matches uploaded row names against existing antibody entry names. Column types (text, integer, float) are automatically inferred, and scientific notation formats (e.g.,
[!NOTE] Multispecific Antibodies: Because multispecific antibodies consist of arbitrary multi-chain constructs (such as bispecifics or CrossMabs), they bypass sequence-level scoring and do not display residue-level stability, surface property, humanness, or liability analysis values in the Project View. For detailed information on designing and managing multispecific constructs, refer to the Assembler documentation.
To run standard analysis and scoring on the individual binding arms of a multispecific entry, you can use the Extract Fvs feature to isolate and save them as individual Fv entries in the project. For details, see the Extract Fvs documentation.
Toolbar & Menu Actions
Analysis Menu
- Alignment: Opens the sequence alignment viewer to compare sequences with selected reference numbering and region schemes.
- Clading: View hierarchical clustering tree diagrams and cladograms of sequences to evaluate panel sequence diversity.
- Liabilities: Opens the liabilities profile dashboard displaying sequence potential liabilities and structural hot-spots.
- Germline: Opens the detailed germline alignment comparison view for selected antibody chains.
- Humanness: Open the OASign humanness score comparison panel.
- PFA: Opens the Positional Frequency Analysis grid viewer to inspect residue frequencies and deep-learning suggestions.
- Covariance: Opens the covariance analysis viewer to investigate and repair broken residue-pair constraints.
- Mutation Grid: Opens a grid highlighting mutations relative to specific parents across engineered designs.
- Physical Properties: Opens the Fv properties grid detailing charges, pI values, and molecular weights.
- Solvent Exposures: View structural residue solvent exposure values (relative SASA and SASA) mapped from Fv models.
- Surface Properties: Opens the surface properties workspace to inspect SPH, SPP, SPN, and SPCD surface hotspot patches.
- Clinical Comparison: Compares project sequence properties and coordinates with therapeutic antibodies in clinical development.
- PLAbDab Search: Query the patent and literature antibody database for sequence similarities.
- Observations: View structural observation flags, mutations, and design metadata.
- Full Re-run Analysis: Triggers a clean re-run of sequence calculations and profiles, refreshing intermediate caching results.
Edit Menu
- Add Fvs and/or Structures...: Add entries to the project and/or add structure files to existing entries.
- Assembler: Open the Assembler interface for the selected Fvs.
- Humanization: Open the Humanization interface for the selected Fv.
- Bulk Humanize...: Humanize multiple selected antibodies in a single batch.
- First Pass Optimize...: Automatically scan for and design mutations to resolve severe developability liabilities in a single step for one or multiple selected entries.
- Engineering: Open the Engineering interface for the selected Fv.
- Engineer pI: Open the pH interface for the selected Fv.
- Surface Mutagenesis: Opens the surface mutagenesis workspace to design variants with modified surface properties.
- Repair Junction: Automatically correct junctions on constant-containing light chains.
- Set Sequence Type...: Review and override automated construct classification, chain stoichiometry, signal peptide leader trimming, and mature sequence liability motif scanning.
- Set Parent...: Set or clear the parent of the selected entries.
- Bulk Edit Notes...: Update notes for multiple selected antibodies at the same time.
- Upload Metadata...: Upload assay values, affinity data, and custom columns to the project grid. Matches entries automatically by name.
- Extract Fvs: Extract variable domains (Fv pairs) from the selected antibodies.
- Structure Models: Open the Structure Models interface to download or delete structure models.
- Build Models: Generate 3D structural Fv or VHH models for the selected entries.
- Delete Identical: Find duplicate entries among selected antibodies based on Fv or Full Length sequence and delete newer duplicates, keeping the oldest entry.
- Delete Selected: Delete the selected entries from the project and database.
Export Menu
- Excel: Export the selected entries to an Excel file with conditional formatting and scoring.
- CSV: Export the selected entries to a CSV file.
- Analysis Report: Export the selected entries to a Word document analysis report.
- Sequences: Visualize or export the selected entries' sequences in multiple formats.
- WIPO ST.26 (Patent)...: Create a WIPO ST.26 (Patent Sequence Listing) formatted sequence data file for patent applications.
- To Project...: Copy or move selected entries into another project (owned or shared with write permissions) with conflict collision resolution, structure preservation, selective metadata column migration, and instant results transfer.
- Export Project (.zip): Export the complete project archive including sequences, 3D structures, and full analysis results.
Sharing
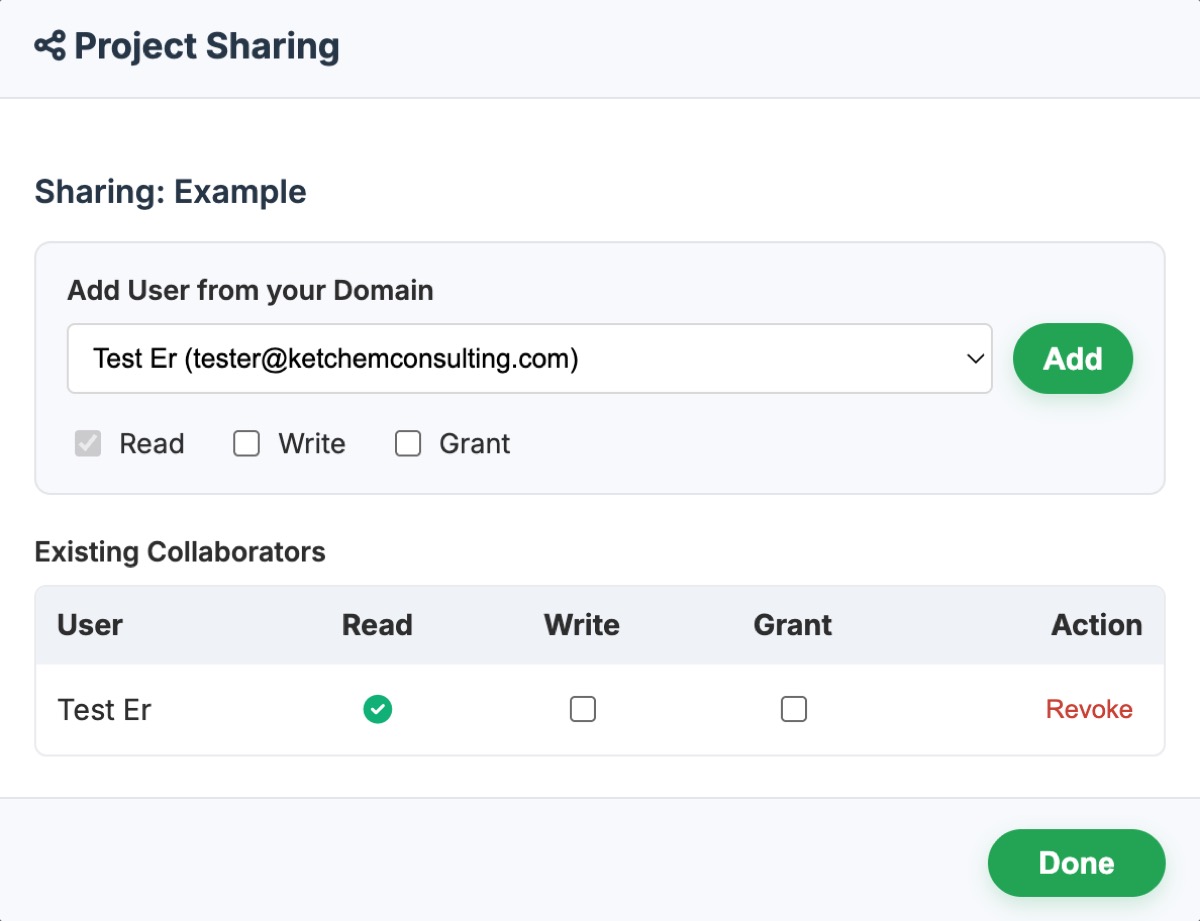
- Share: Open the sharing dialog to grant or manage access to the project for other users within the same organization (same company or email domain) (requires appropriate permissions). Sharing may also be performed from the main Dashboard.
Conditional Formatting Rules
To help evaluate antibody developability and lead selection at a glance, the Project View applies color-coded conditional formatting based on established ranges and thresholds:
| Metric / Value | Good (Green: #88B46C) |
Low / Medium (Yellow: #F8D548 / Orange: #E29848) |
High / Alert (Red: #CF4A3C) |
|---|---|---|---|
| KBC Score | ≤ 11.5 | Orange: 17.5 < Score ≤ 24.0 Yellow: 11.5 < Score ≤ 17.5 |
> 24.0 |
| Nearest Neighbor | ≥ 10.0% | Yellow: 5.0% < Distance < 10.0% | ≤ 5.0% |
| Sapiens (Humanness) | ≥ 0.85 | Yellow: 0.75 ≤ Score < 0.85 Orange: 0.65 ≤ Score < 0.75 |
< 0.65 |
| OASign (Humanness) | ≥ 0.8500 | Yellow: 0.7500 ≤ Score < 0.8500 | < 0.7500 |
| RPEMHC VL / VH | ≤ 0.2000 | Yellow: 0.2000 < Score ≤ 0.3000 | > 0.3000 |
| RPEMHC Fv | ≤ 0.3500 | Yellow: 0.3500 < Score ≤ 0.4500 | > 0.4500 |
| AbLang (Full) | ≤ 45.0 | Yellow: 45.0 < Score ≤ 70.0 Orange: 70.0 < Score ≤ 90.0 |
> 90.0 |
| AbLang FR | ≤ 15.0 | Yellow: 15.0 < Score ≤ 25.0 Orange: 25.0 < Score ≤ 35.0 |
> 35.0 |
| AbLang2 (Full) | ≤ 9.0 | Yellow: 9.0 < Score ≤ 14.5 Orange: 14.5 < Score ≤ 19.0 |
> 19.0 |
| AbLang2 FR | ≤ 3.5 | Yellow: 3.5 < Score ≤ 6.5 Orange: 6.5 < Score ≤ 10.0 |
> 10.0 |
| IgBert (Full) | ≤ 12.0 | Yellow: 12.0 < Score ≤ 20.0 Orange: 20.0 < Score ≤ 30.0 |
> 30.0 |
| IgBert FR | ≤ 3.5 | Yellow: 3.5 < Score ≤ 7.5 Orange: 7.5 < Score ≤ 12.0 |
> 12.0 |
| Covariance (CVV Full) | ≤ 20.0 | Yellow: 20.0 < Score ≤ 35.0 Orange: 35.0 < Score ≤ 55.0 |
> 55.0 |
| Covariance (CVV FR) | ≤ 1.0 | Yellow: 1.0 < Score ≤ 3.0 Orange: 3.0 < Score ≤ 6.0 |
> 6.0 |
| # Severe FR Violations | 0 | Yellow: 1 to 2 Orange: 3 to 4 |
≥ 5 |
| SPH (Hydrophobicity) | ≤ 100.91 (75th percentile) | Yellow: 100.91 < Score ≤ 113.34 | > 113.34 (95th percentile) |
| SPP (Positive Charge) | ≤ 0.57 (75th percentile) | Yellow: 0.57 < Score ≤ 1.00 | > 1.00 (95th percentile) |
| SPN (Negative Charge) | ≤ 0.33 (75th percentile) | Yellow: 0.33 < Score ≤ 1.15 | > 1.15 (95th percentile) |
| SPCD (Charge Interaction) | ≥ -2.3 (25th percentile) | Yellow: -11.4 ≤ Score < -2.3 | < -11.4 (5th percentile) |
| pI | 8.0 ≤ pI ≤ 10.0 | Yellow: 7.6 ≤ pI < 8.0 or 10.0 < pI ≤ 11.0 | < 7.6 or > 11.0 |
| Disrupted CDR3 Salt Bridge | 0 (Intact) | - | ≥ 1 (Disrupted) |
| Cysteines / Potential PTMs | 0 detected | Orange: 2 detected Yellow: 1 detected |
≥ 3 detected |
| CDR-L1 Length | 11 to 14 | Yellow: 10 or 15 to 17 | < 10 or > 17 |
| CDR-L2 Length | 8 | - | ≠ 8 |
| CDR-L3 Length | 9 to 11 | Yellow: 7 to 8 or 12 to 13 | < 7 or > 13 |
| CDR-H1 Length | 13 to 16 | - | < 13 or > 16 |
| CDR-H2 Length | 9 to 12 | - | < 9 or > 12 |
| CDR-H3 Length | 11 to 16 | Yellow: 5 to 10 or 17 to 30 | < 5 or > 30 |
| CDR Length Sum | 64 to 78 | Yellow: 53 to 63 or 79 to 93 | < 53 or > 93 |
Additionally, cell backgrounds are colored for specific designations:
- Non-Human Origin: Light Orange (#E29848 equivalent or tinted)
- Kappa Variable Light (VL): Light Kobicha
- Lambda Variable Light (VL): Light Lavender
Searching Entries
A project-level search bar is available directly inside the Project View's inner toolbar to filter the results table dynamically using substrings, area filters, motifs, or region-level scopes:
-
Standard Search: Enter any name, note substring, label, or sequence subsequence (e.g.,
EVQLV) to find matching records across all columns and sequences. -
Area Filters: Use the Area Filter dropdown selector on the toolbar search bar or specify a search prefix to restrict queries to specific fields:
name:<query>/entry:<query>: Restricts match to antibody/entry names.notes:<query>: Restricts match to entry engineering notes.seq:<query>: Restricts match to amino acid sequences (including PROSITE motifs and domain scopes).germline:<query>: Restricts match to germline annotations (species, V-gene, J-gene, leader, constant domain).meta:<query>: Restricts match to custom metadata columns and results cell values.
-
PROSITE Motif Search: Enter NCBI/PROSITE regular expression motifs (e.g.,
N{P}[ST]{P}) to scan sequences for complex patterns. -
Domain Modifiers: Appending a suffix scope restricts sequence searches to specific regions:
.Fv: Restricts sequence search to both variable domains (Variable Heavy + Variable Light)..VH: Restricts sequence search to the Variable Heavy domain only..VL: Restricts sequence search to the Variable Light domain only.
Example: Searching for seq:N{P}[ST].VH will filter the table to show only antibodies with a potential N-glycosylation site in their Variable Heavy chain region.
References
- The Potential PTMs are described in Satława et al., PLoS Comp Biol (2024).
- CDR Length is determined using AntPack.
- Genetic Origin is determined using ANARCI.
- Humanness is determined using OASign against curated human 9-mer sequences from the Observed Antibody Space (OAS).
- RPEMHC (MHC-II binding prediction) is based on the DeepMHCII / RPEMHC ensemble deep learning model for predicting class II peptide-MHC binding affinity. Described in Wang et al., Bioinformatics (2024).
- Sapiens details are described in Prihoda et al., mAbs (2022).
- The Immunogenicity Database Collaborative (IDC) dataset details are described in IDC Consortium, Frontiers in Immunology (2023).
- AbLang details are described in Olsen et al., Bioinformatics Advances (2022).
- AbLang2 details are described in Olsen et al., bioRxiv (2024).
- IgBert details are described in Kenlay et al., arXiv (2024).
- The background inspiration for the Surface Properties (Tap-like method) is described in Raybould et al., PNAS (2019).
- ABodyBuilder2 (ImmuneBuilder) is described in Abanades et al., Bioinformatics (2023).
- The Bjellqvist pI method is described in Bjellqvist et al., Electrophoresis (1993) and Bjellqvist et al., Electrophoresis (1994).